
Italian National Research Council
Department of Earth Observation
| Home |
| Projects |
| ORM for MIPAS |
| ASSET |
| AMIL2DA |
| MIPAS special modes |
| Marschals |
| Products |
| Events |
| Publications |
| Team |
| Maps of 30 - 31 August 2003 |
||||||||||||||||||||||||||||||||||||||||||||
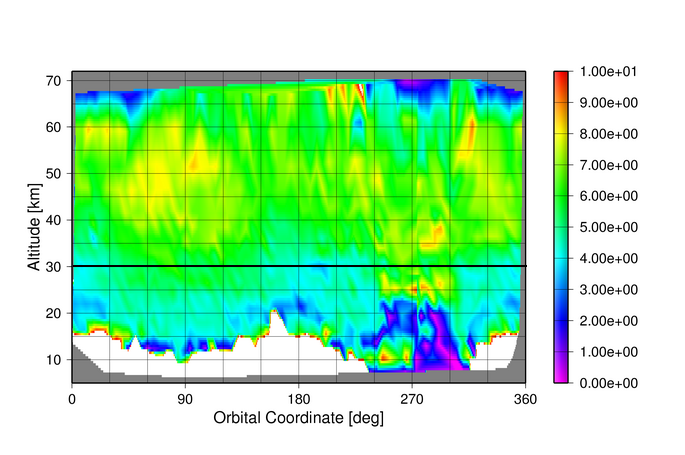
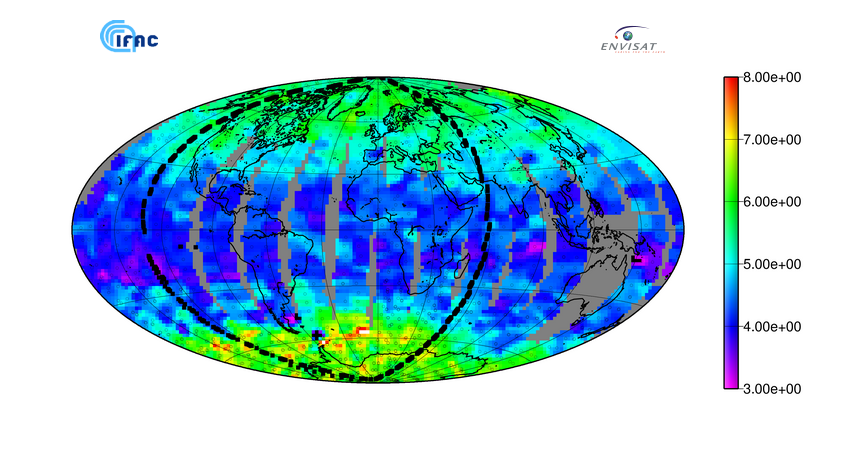
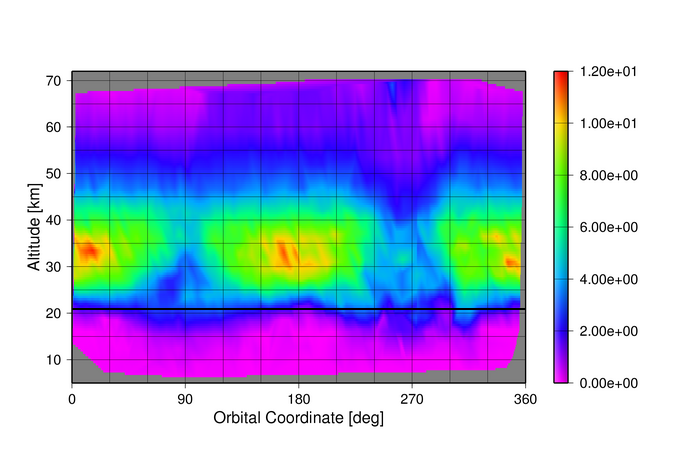
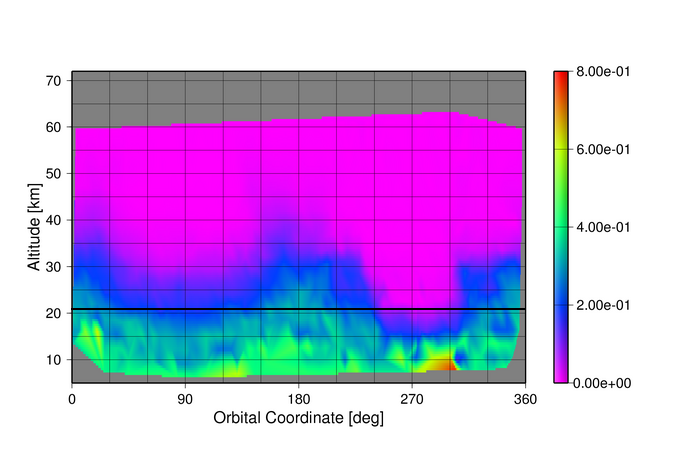
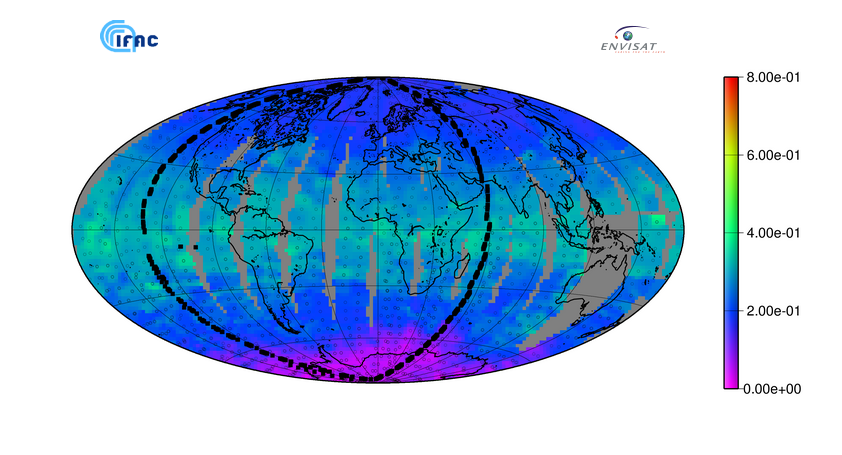
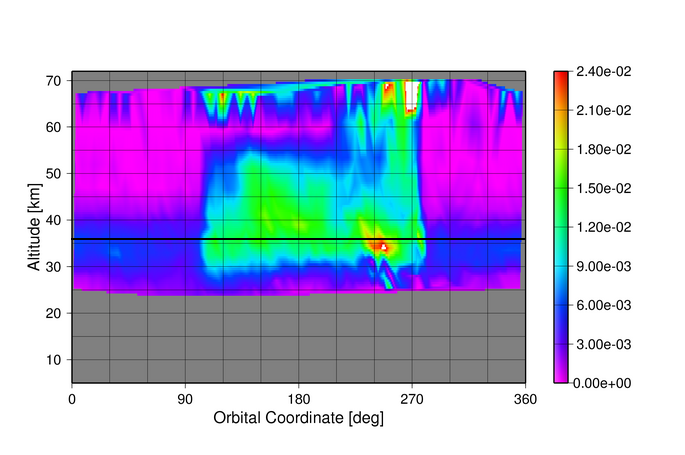
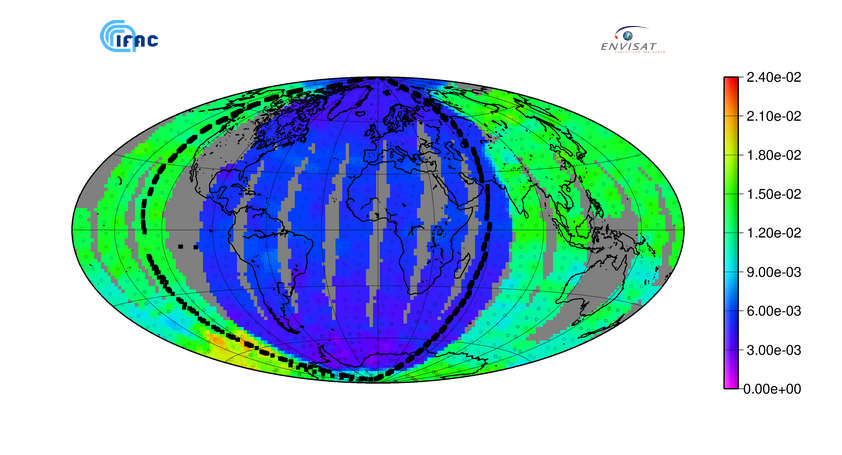
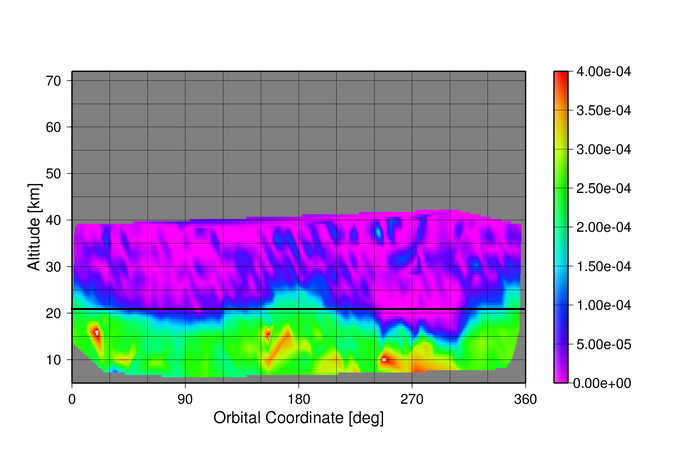
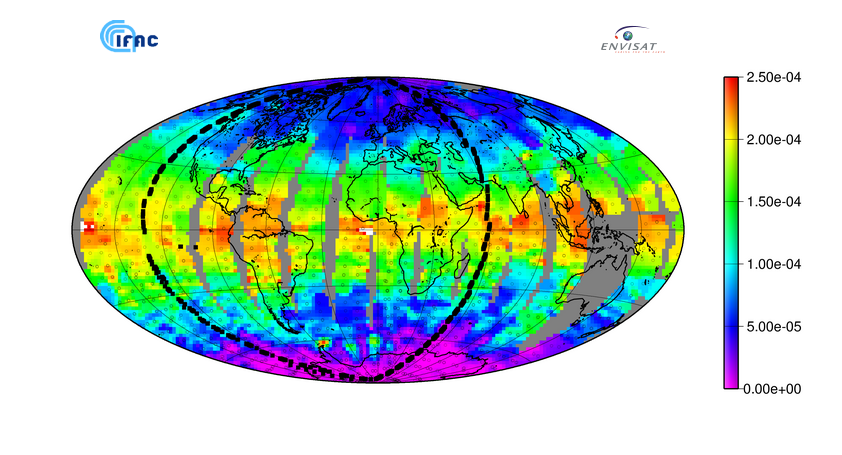
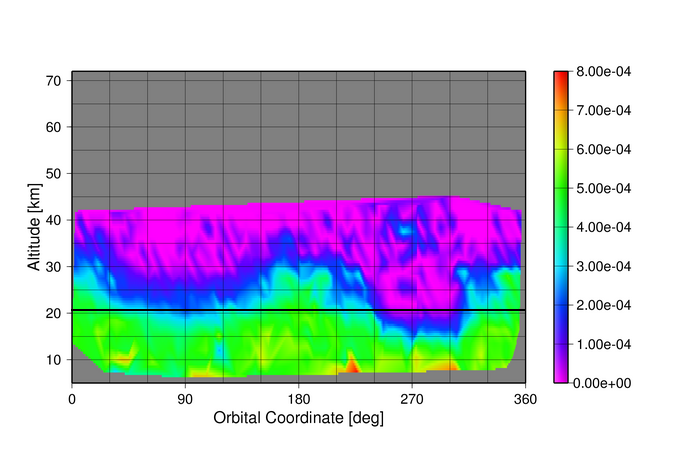
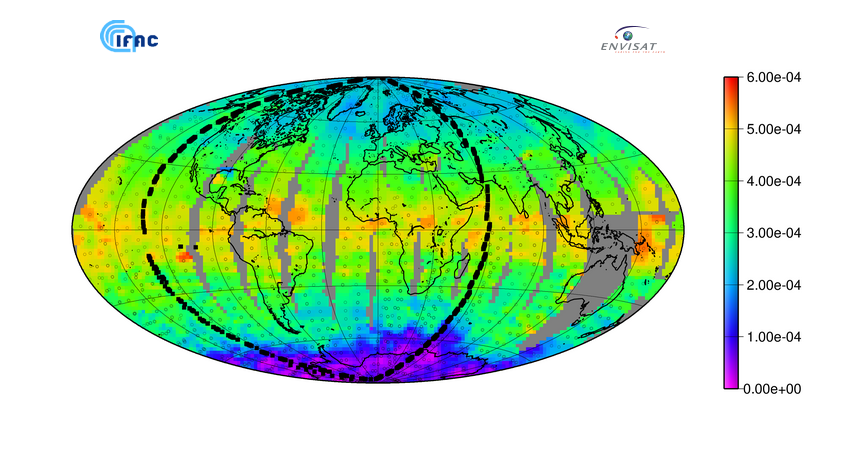
Maps of temperature (K)
and volume mixing ratio (ppmv) of
several species (re-analysis of MIPAS measurements
with ORM).
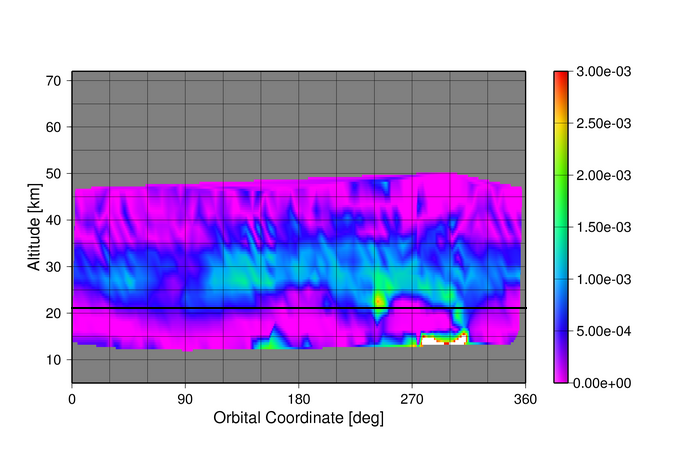
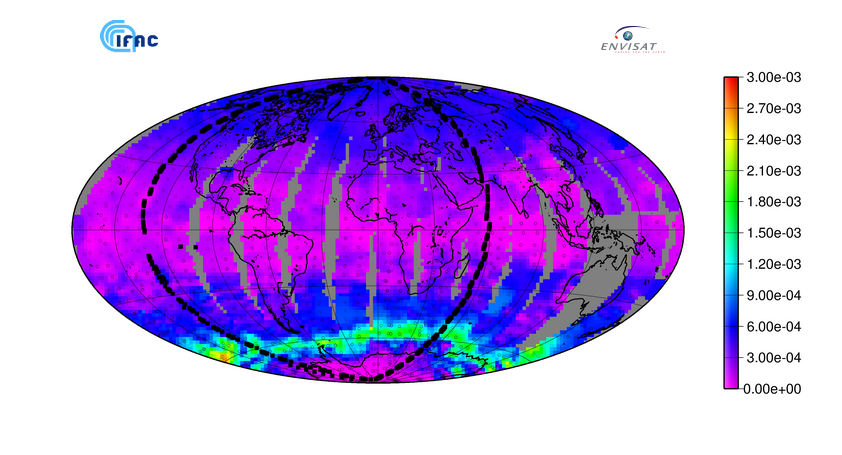
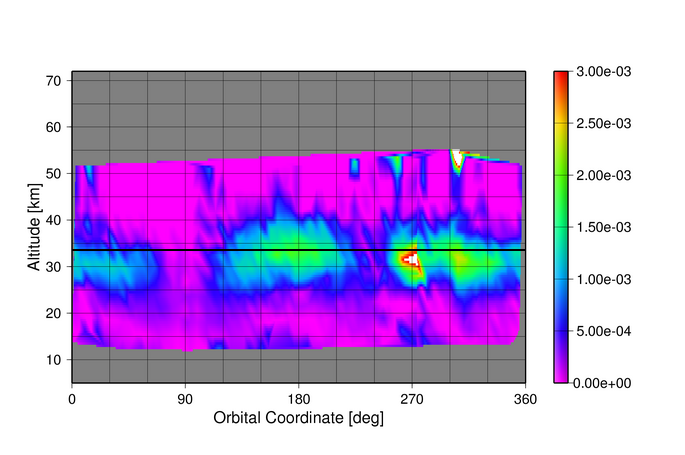
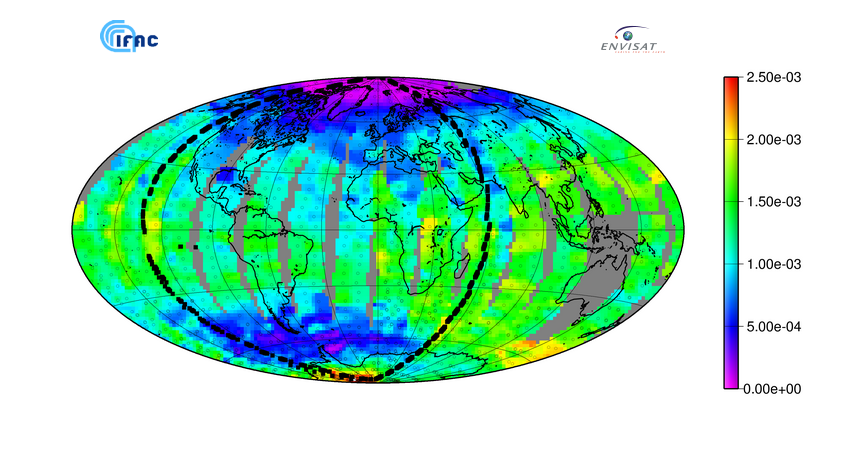
This re-analysis provides an extension in the altitude range of the retrieval as well as further atmospheric constituents relative to the near real time ESA processing. However it is for the moment limited to a few measurements. An example is provided for measurements of 30-31 August 2003. Maps on the left correspond to the orbit indicated in black on the world maps. Maps on the right correspond to the altitude indicated by the black line on the left maps. The orbital coordinate is related to the latitude and its value is 0 and 180 at the equator and 90 and 270 respectively at the north pole and at the south pole. |
||||||||||||||||||||||||||||||||||||||||||||
|
||||||||||||||||||||||||||||||||||||||||||||
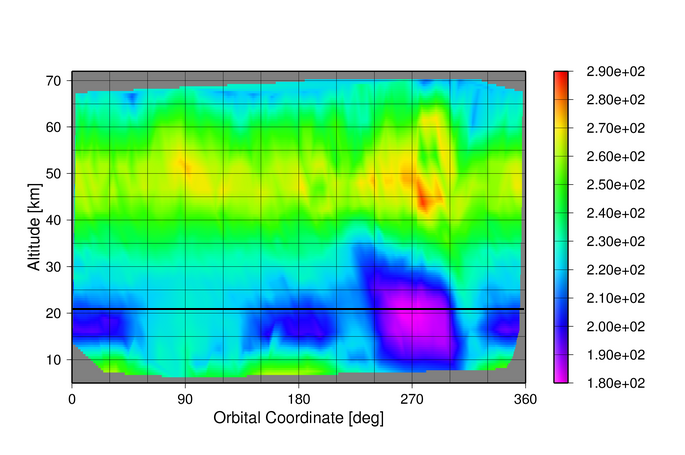
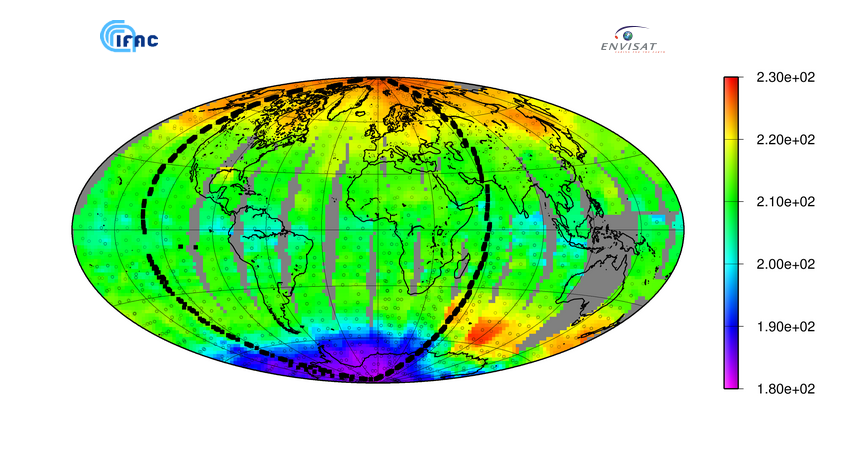


Temperature
H2O
O3
HNO3
CH4
N2O
NO2
ClONO2
N2O5
CFC-11
CFC-12